fbpx
TSP Pilot is an independent commercial service. We are not affiliated with the TSP, Thrift Savings Plan, tsp.gov, frtib.gov, or any U.S. government agency or uniformed military services.

Get the Next 2 Updates for Just $1

TSP investing made easy. Get your first month for just $1.

Start $1 Trial →

Cancel anytime

Market Commentary

Published July 27th, 2025

Summary

  • C Fund and S Fund rose 2%; I Fund gained 1½%.
  • ‘Animal spirits’ are pushing stock prices to new heights.
  • Jeremy Grantham details why the enthusiasm is unwarranted.

“The habit of buying into stock weakness has become increasingly hard-wired into investors in the decade-and-a-half that followed the 2008-09 global financial crisis, during which downturns have tended to be short-lived,” the Financial Times reported. “Pops and drops will occur, but the dip-buying belief has become the new religion,” said Visdom Investment Group’s Mike Zigmont. “Dip-buying works brilliantly until it doesn’t,” warns Rob Arnott of Research Affiliates. “When you have a meltdown, it’s a quick path to deep regret.”

A new set of meme stocks have lit the imaginations of retail speculators, while Google searches for “options strategies” and “day trading” are both almost six standard deviations above the average. For perspective, two standard deviations happen 5% of the time and three should occur less than 1% of the time; six standard deviations are the statistical equivalent of Haley’s Comet.

Global stock markets reacted positively to our trade deal with Japan – however, the 15% tariff is almost 10x the current rate. To date, exporting countries have been passing along the increased costs to U.S. importers and consumers. So far, we haven’t seen higher prices and lower profit margins because of the huge front-loading of inventories this Spring and the lag times in transcontinental shipping, but the impact is coming.

On the monetary front, we don’t expect the Federal Reserve to cut rates at its meeting next week. In addition to tariff fears, the central bank’s decision will be influenced by an inflation report that was somewhat disappointing when you drill down on the numbers. Also, as Reuters reports, financial conditions are already the loosest they’ve been in nearly four years. (Further details in the Economic Overview)

U.S. markets continued to reach new all-time highs last week, driven by relatively strong Q2 earnings. We’ll look to see if the trend continues this week as several mega-cap tech companies, Amazon, Apple, Meta, and Microsoft, report their results. This week also brings two key catalysts to the forefront: the Federal Reserve meeting on Wednesday and the expiration of the 90-day tariff deadline on Friday. The Fed is expected to keep rates unchanged, with the probability of a cut near zero. This may further strain the already contentious relationship between the Administration and Fed Chair Powell, as the President’s team continues to advocate for lower rates. Additionally, the expiration of the tariff deadline will most likely prompt the Administration to implement reciprocal tariffs on foreign trading partners, which could potentially add to near-term market volatility. We will hold steady this week in both our Conservative and Aggressive Portfolios and will be in touch no later than August 10th with updated allocations and reasoning.

TSP Pilot’s Conservative Allocations are 63% to the G Fund (short-term Treasury securities), 29% to the C Fund (large-capitalization U.S. stocks), 5% to the S Fund (small-cap U.S. stocks), 3% to the I Fund (international stocks), and 0% to the F Fund (U.S. bonds). Aggressive Allocations are 47% to the C Fund, 40% to the G Fund, 10% to the S Fund, 3% to the I Fund, and none to the F Fund.

Reality Check

The CAPE ratio, which looks at price-earnings multiples over a ten-year period (to smooth out the short-term ups and downs in the economy) is now above 37x. Since 1980, each time the multiple has been this elevated, investors suffered over the subsequent decade. This terrible track record is especially striking since the past 45 years have seen the largest increase in stock prices ever.

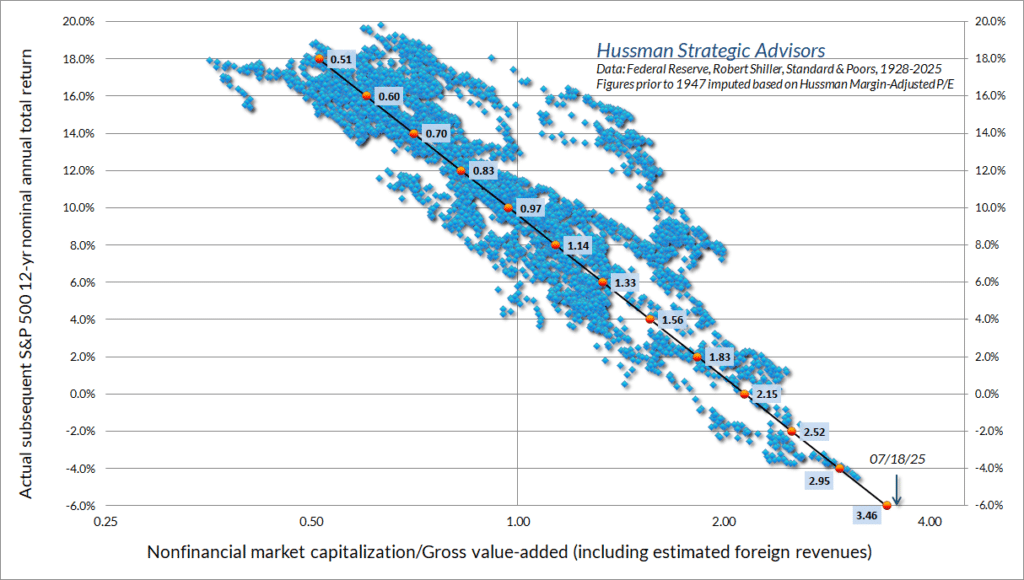
The highly regarded Buffett Indicator is even more cautionary. Though the chart below is overwhelming at first glance, its message is clear: looking at the results over many decades, the current level of the indicator – the arrow in the lower right – projects an average annual decline of 6% in the C Fund over the next dozen years.


Economic Overview

The fixed-income market is projecting confidence in the outlook – overconfidence, really. According to Almost Daily Grant’s, the high-yield bond index is yielding less than 3 percentage points above Treasuries, far below the 5-point average these past two decades. Moreover, those junk bonds that have managed to default despite the current solid economy recouped only about 30 cents on the dollar for their investors (vs. a historical average north of 50).

The retail sales report for last month came in on target, a solid showing in contrast to the weak results from shipping – Cass, which compiles the Freight Index, noted that “the effects of tariffs may worsen, as higher goods prices reduce affordability and real incomes.” A more forward-looking metric, LegalShield’s Consumer Stress Index, highlighted a 30% spike in legal inquiries concerning foreclosure.

The closely watched Consumer Price Index rose 2.7%, as expected – this is a vast improvement relative to the inflation spike of recent years, though still above our central bank’s 2% target rate. Moreover, the numbers are suspect: health insurance up 3½%?! (As Peter Boockvar points out, insurers are proposing premium increases topping 20% in some states.)

The more-relevant inflation measures – “median”, “sticky”, “trimmed mean”, and “supercore” – all worsened from the previous reading, and are tracking higher than 3%. “The direction of travel matters,” concludes Bloomberg’s John Authers, “and it’s going the wrong way.”

Another key metric was flagged by Nobel Laureate Paul Krugman: “Look at S&P Global’s Purchasing Managers’ Index for manufacturing which shows the percentage of firms reporting higher prices: a higher number almost always points to rising inflation ahead, and right now it’s definitely telling us that tariffs are about to hit hard.”

Fund Performance Under Maintenance

Fund Performance

As of August 27th, 2025

G fund
1 week
0.08%
1 month
0.4%
YTD
2.93%
2024
4.4%
2023
4.22%
F fund
1 week
0.37%
1 month
1.3%
YTD
4.96%
2024
1.33%
2023
5.58%
C fund
1 week
1.36%
1 month
1.57%
YTD
11.11%
2024
24.96%
2023
26.25%
S fund
1 week
3.59%
1 month
2.72%
YTD
9.02%
2024
16.93%
2023
25.3%
I fund
1 week
0.05%
1 month
1.18%
YTD
21.75%
2024
4.27%
2023
18.38%

In-Depth Analysis

“You can’t possibly call a bubble or a bust to the right day except once every several lifetimes,” said investing icon Jeremy Grantham in a recent interview. “What you can do, though, is to identify bubbles that eventually burst.”

The latest leg of our stock-market bubble – from mid-2020 to the present day – benefitted from good fortune, which in turn fueled enthusiasm to the point of euphoria. In late-March 2020, a massive (and rare) bipartisan bailout in conjunction with an unprecedented Fed easing lit the fuse under the stock market. By November, the rally was at risk: fair value had given way to overvaluation, and production was still at a standstill due to the pandemic. Fortunately, Covid vaccines were developed in record time – the first of which was announced on November 9th – restarting the world economy.

By the end of 2021, valuations hit extreme levels even as supply-shock inflation began its upward march. Central banks worldwide were slow to respond to the accelerating rise in prices – and when they did, fears grew that the spike in interest rates would trigger a global recession. The decline in stock prices in 2022 might have been the first leg of a multi-year bear market if not for the surprise announcement of ChatGPT. The seemingly unlimited potential of artificial intelligence reignited the market’s speculative instincts.

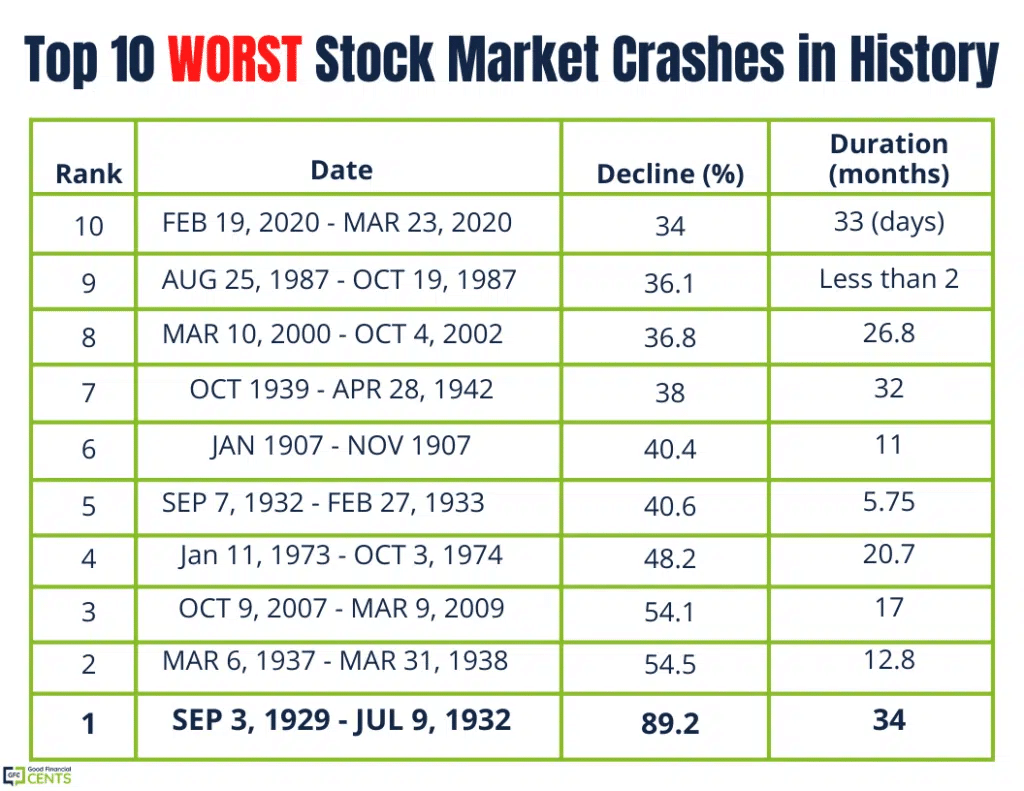
Although the major surprises these past five years have been favorable, history reminds us that the unexpected can turn against us as well. The Smoot-Hawley Act of 1930 transformed a business downturn into a global depression, taking the benchmark stock index almost 90% lower. The 1973 oil embargo ushered in a decade of severe stagflation and collapsed the stock & bond markets. In October 1987, the catastrophic failure of portfolio insurance was a key culprit in the worst single-day decline ever. Lehman Brothers’ bankruptcy in 2008 triggered both the Great Financial Crisis and the halving of the C Fund.


People generally believe that financial cycles are caused by hype that fails to materialize (such as dotcom fly-by-nights) but as Jeremy Grantham noted, most stock-market booms and busts are based on successful technologies: trans-Atlantic shipping in the 1700s, railroads in the 1800s, transportation & telecommunications in the 1900s, and the Internet this century.

Success breeds excess – competition causes creative destruction to profit margins and stock prices (“You didn’t need six railroads between Manchester and Leeds”). Notably, even the greatest success story of the past 30 years – Amazon – suffered a 92% price decline in the dotcom bust. Nonetheless, “we have such a desperate predisposition for good news,” says Grantham. “And no interest at all in the future – extrapolate today’s conditions forever. We never anticipate anything.

“The average investor is not worried until the hammer lands on the head, clearly and squarely,” he adds, warning that the rose-tinted bias applies even more forcefully to advisors. In his seven-decade tenure on Wall Street, Grantham has observed that investors freeze during bear markets, but during bull markets they actively seek up-trending stocks and upbeat advisors.

The danger here is two-fold: you can lose a lot of money in a bear market, and you can lose any desire to buy into the subsequent bull market. Most investors have little or no memory of the grim 2000-2003 sell-off, and the devastating effect on the collective psyche. The 2008-2009 bear market was essentially only six months (though it felt a lot longer), whereas the 2000 decline lasted a mere five weeks.

“Once in a blue moon, you get hit from every direction,” Grantham recalled, “not just on the head but here there and everywhere, and we exaggerate the bad news: 1974, been there done that, 7½ times very depressed earnings … 1982, 8 times very depressed earnings.” By contrast, “2000, 35 times very inflated earnings. We are not an organism trying to normalize, we double-count when given half a chance.”

“Serious measures of value say this is the highest-priced stock market in the history of the U.S. – this is not a good sign for long-term returns. It’s killing to get the timing right, but the consequences are never different. Always goes back to reasonable prices.”